New! Render PlantUML diagrams directly inside GitHub
with our official browser extension —
No server. No tokens. No tracking. Zero permissions but clipboard. —
Try it out and let us know what you think!
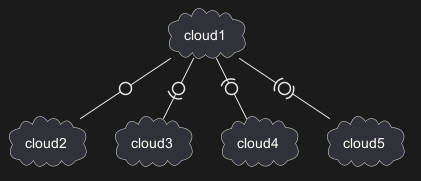
Диаграмма развертывания
Диаграмма развертывания - это тип диаграммы, визуализирующий архитектуру систем, показывающий, как программные компоненты развертываются на аппаратном обеспечении. Она дает четкое представление о распределении компонентов по различным узлам, таким как серверы, рабочие станции и устройства. С помощью PlantUML создание диаграмм развертывания становится простым делом. Платформа предлагает простой и интуитивно понятный способ создания таких диаграмм с использованием обычного текста, что обеспечивает быстроту итераций и удобство контроля версий. Кроме того, форум PlantUML представляет собой активное сообщество, где пользователи могут обращаться за помощью, делиться идеями и совместно решать проблемы, связанные с созданием диаграмм. Одним из ключевых преимуществ PlantUML является его способность легко интегрироваться с различными инструментами и платформами, что делает его предпочтительным выбором как для профессионалов, так и для энтузиастов. Объявление элемента
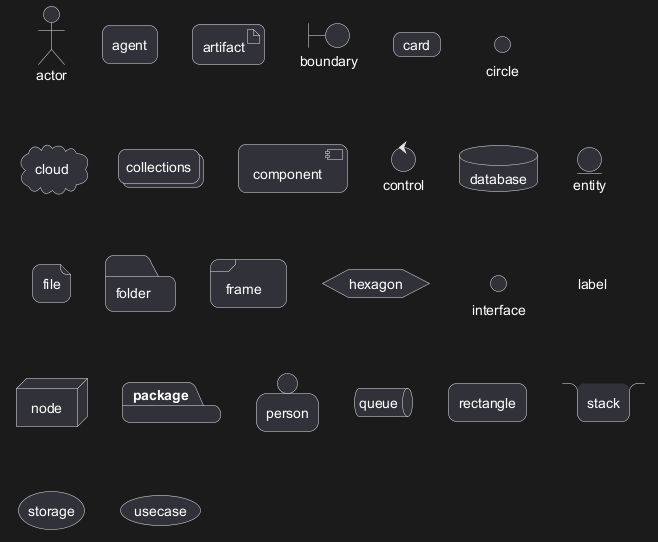
[].
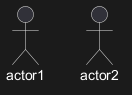
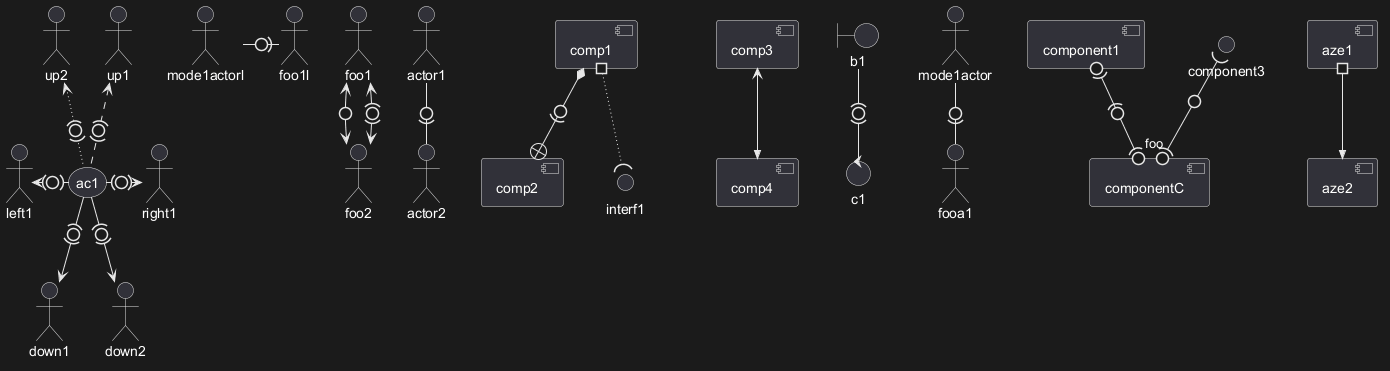
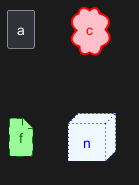
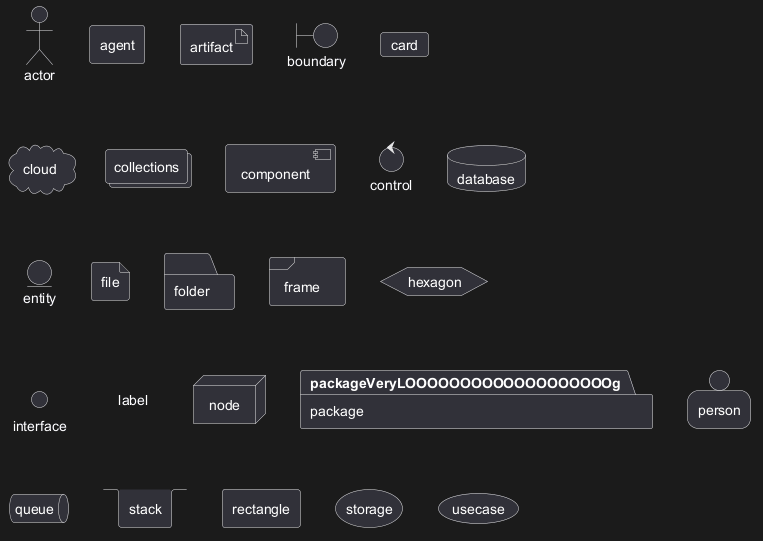
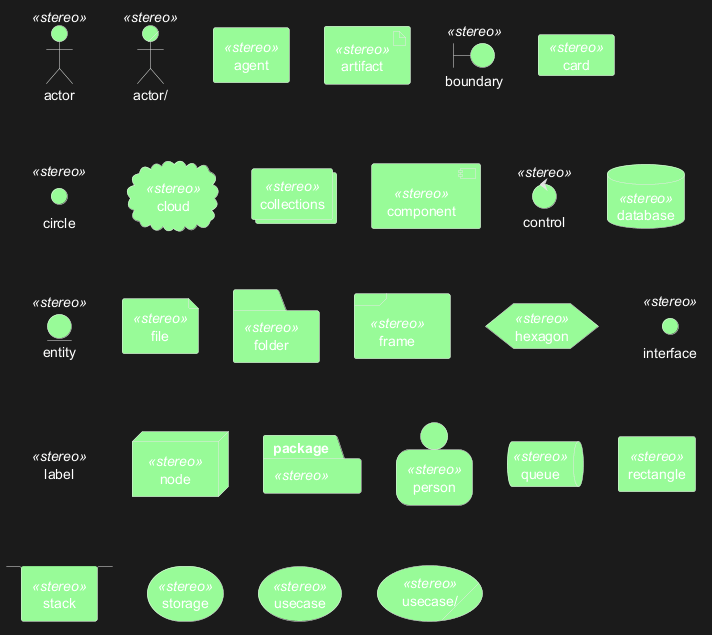
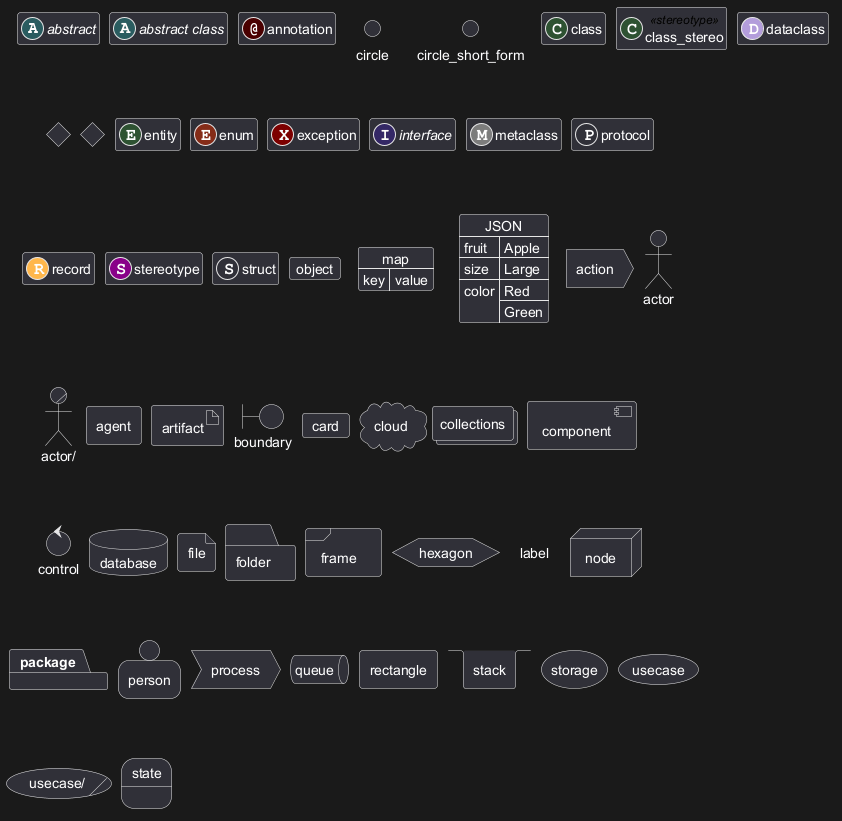
Declaring element (using short form)
We can declare element using some short forms.
| Long form Keyword | Short form Keyword | Long form example | Short form example | Ref. |
actor
|
: a :
|
actor actor1
|
:actor2:
|
Actors |
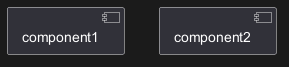
component
|
[ c ]
|
component component1
|
[component2]
|
Components |
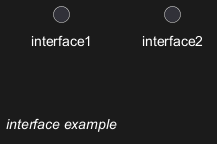
interface
|
() i
|
interface interface1
|
() "interface2"
|
Interfaces |
usecase
|
( u )
|
usecase usecase1
|
(usecase2)
|
Usecases |
Actor
Component
Interface
Usecase
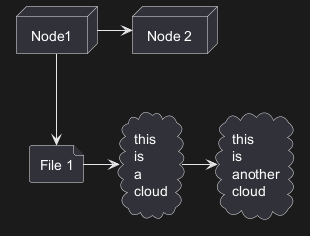
Linking or arrow
You can create simple links between elements with or without labels:
Bracketed arrow style
Similar as Bracketed class relations (linking or arrow) style
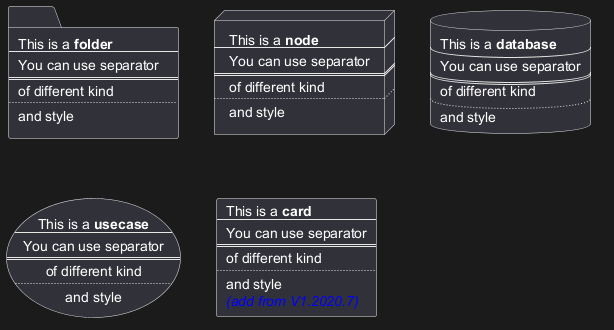
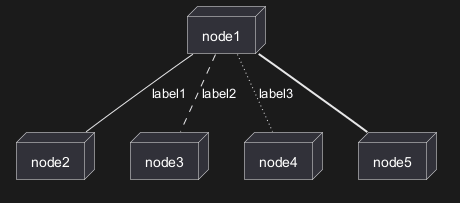
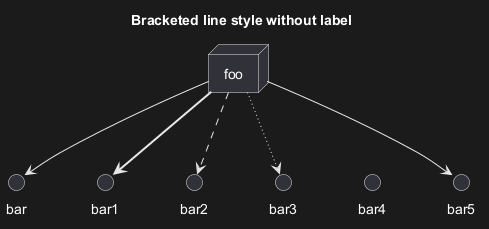
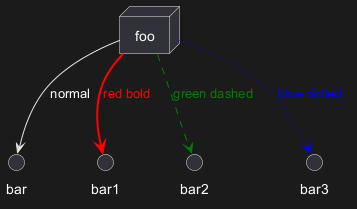
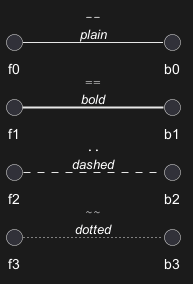
Line style
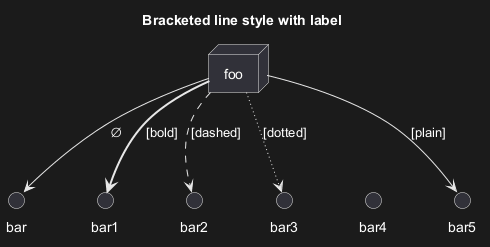
It's also possible to have explicitlybold, dashed, dotted, hidden or plain arrows:- without label
- with label
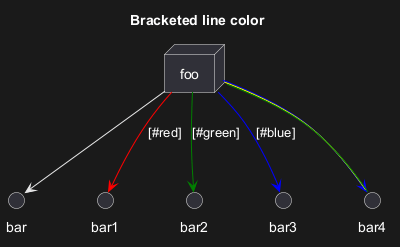
Line color
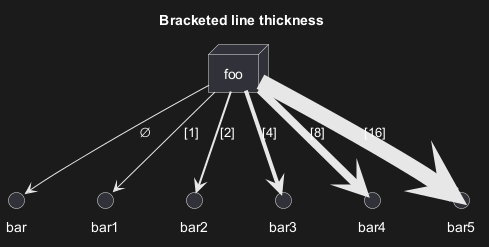
Line thickness
Mix
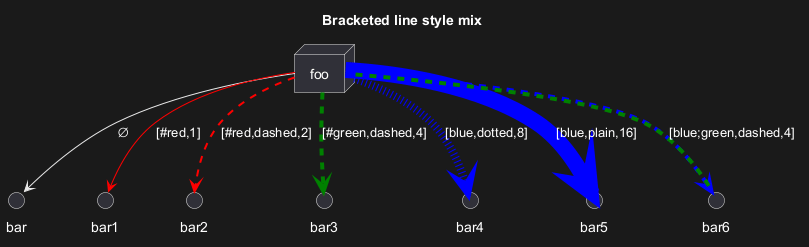
Change arrow color and style (inline style)
You can change the color or style of individual arrows using the inline following notation:
#color;line.[bold|dashed|dotted];text:color
Change element color and style (inline style)
You can change the color or style of individual element using the following notation:
#[color|back:color];line:color;line.[bold|dashed|dotted];text:color
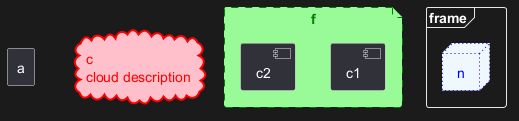
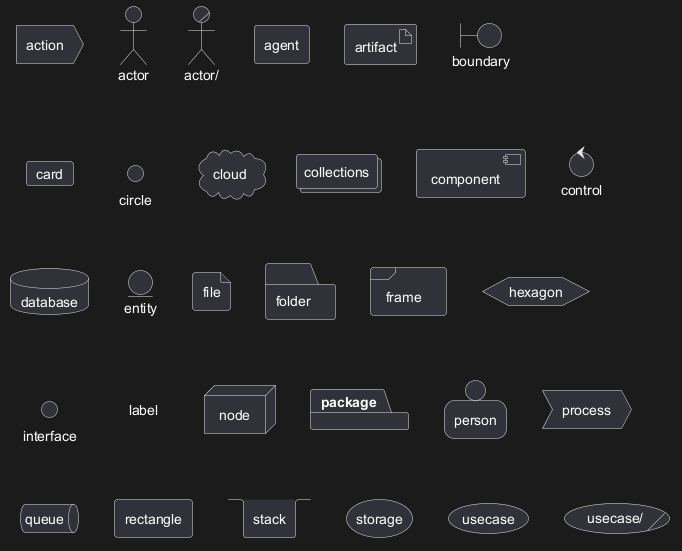
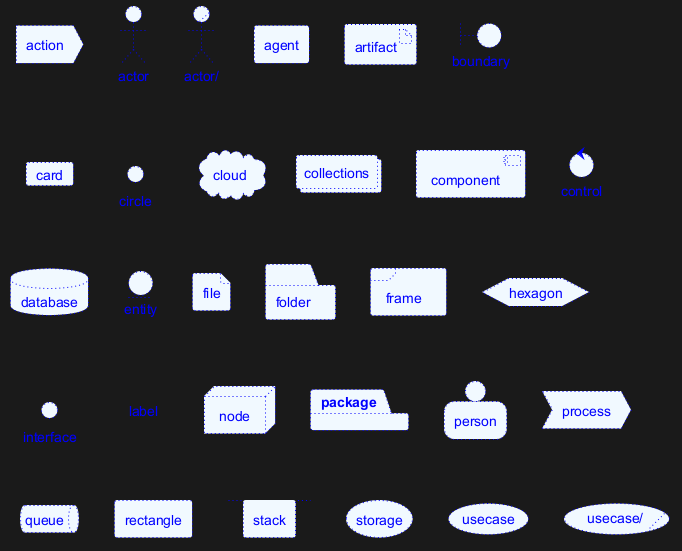
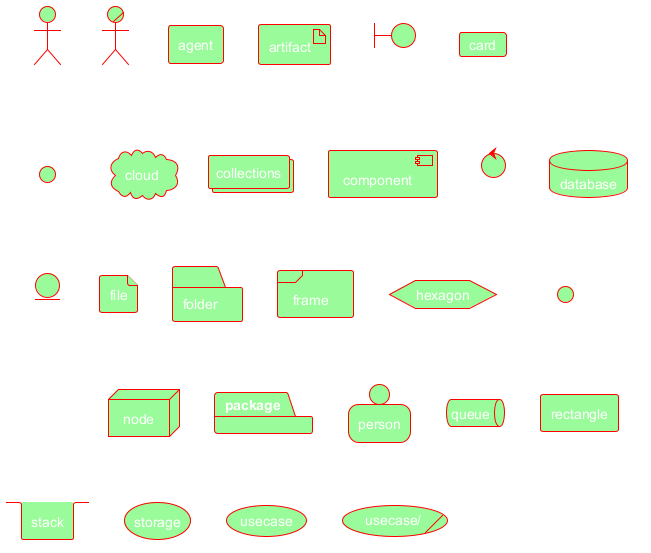
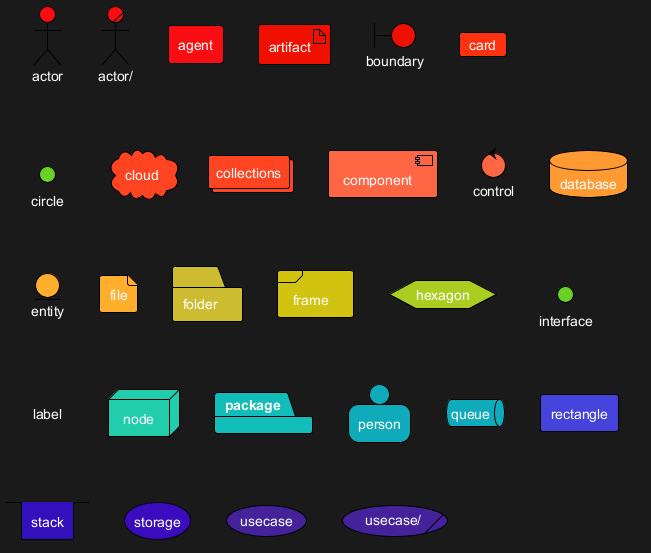
Nestable elements
Here are the nestable elements:

Packages and nested elements
Example with one level

Other example
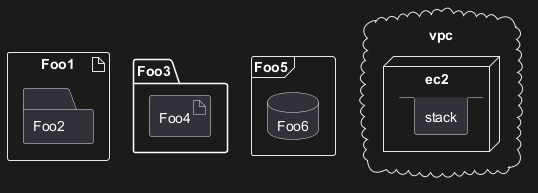
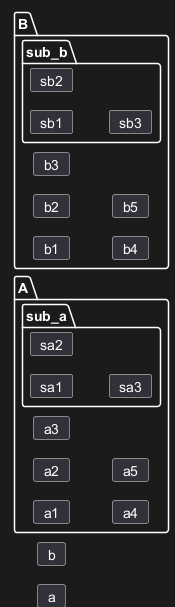
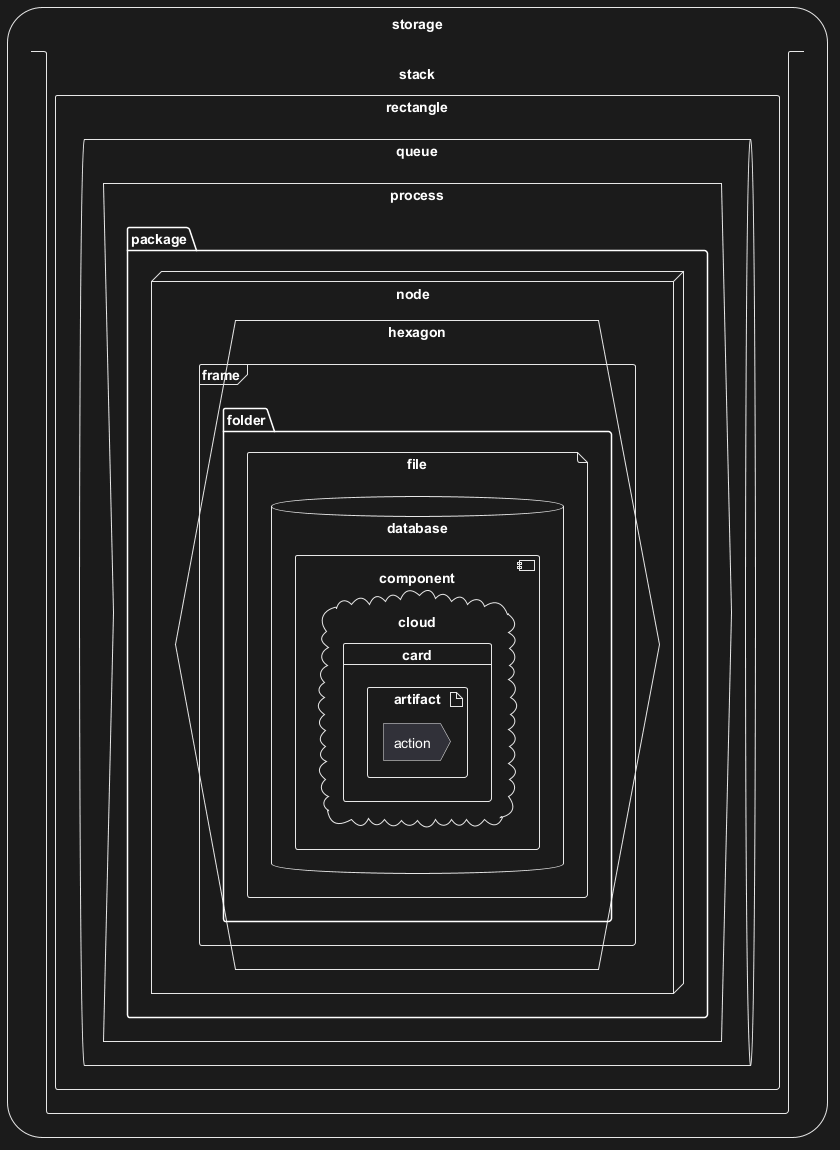
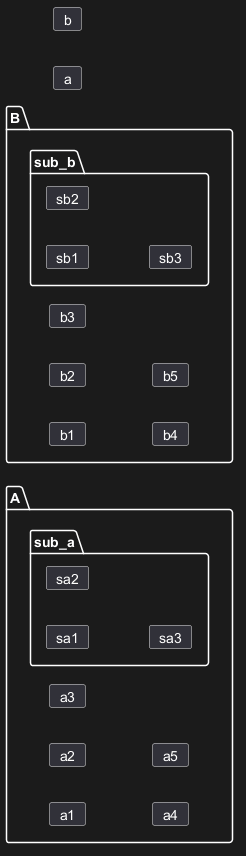
Full nesting
Here is all the nested elements:- by alphabetical order:
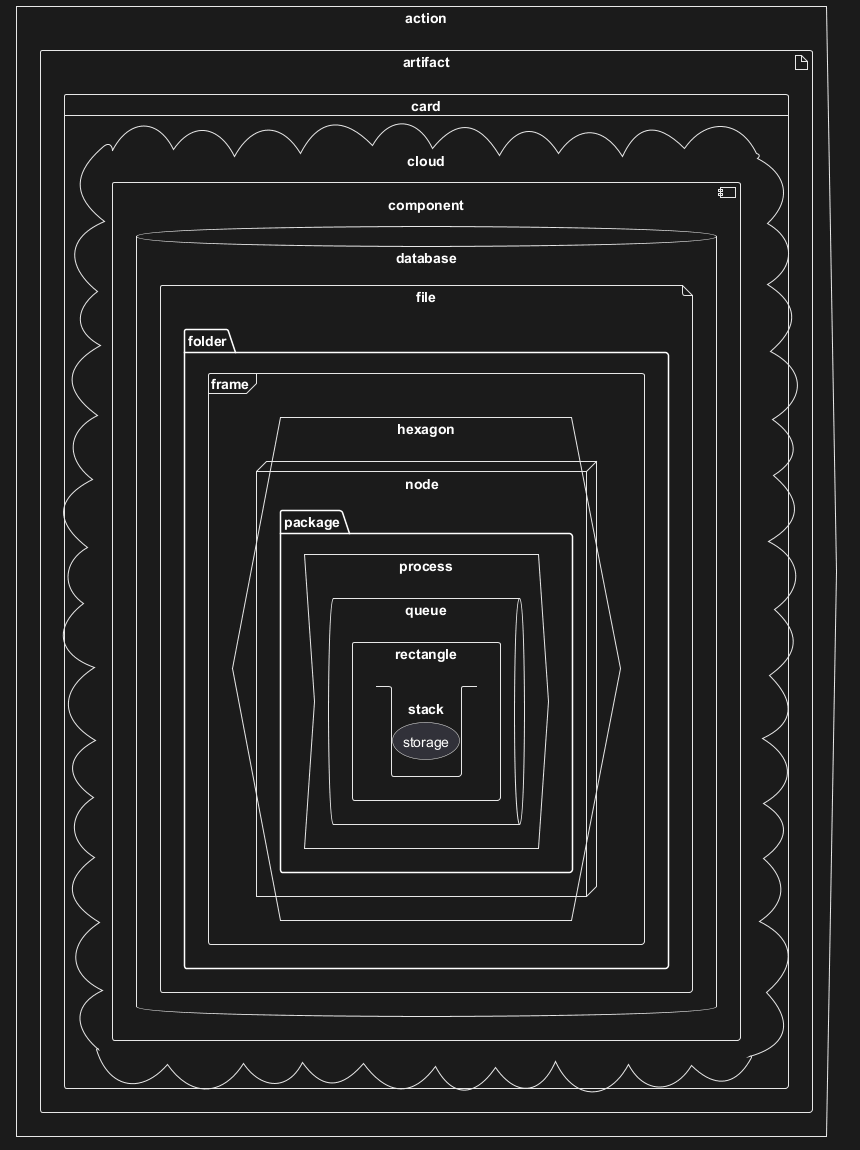
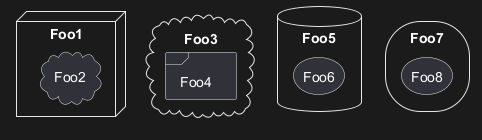
- or reverse alphabetical order
Alias
Simple alias with as
Examples of long alias

Round corner
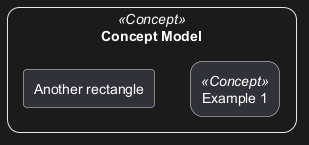
Specific SkinParameter
roundCorner
Appendix: All type of arrow line
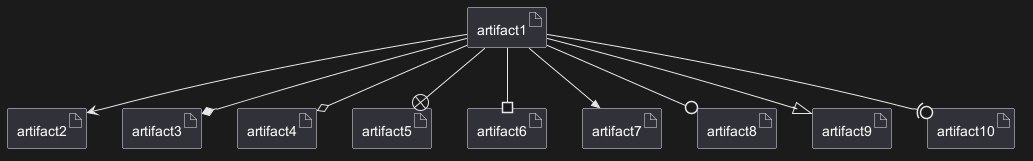
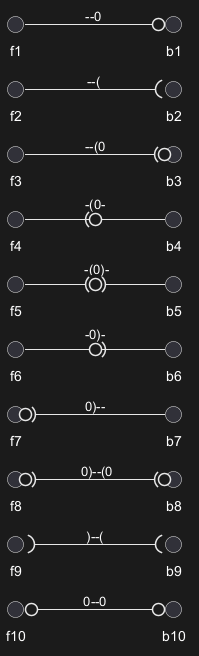
Appendix: All type of arrow head or '0' arrow
Type of arrow head
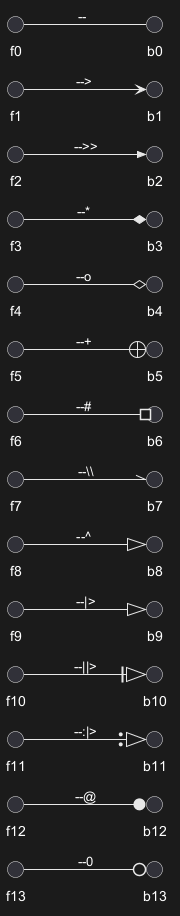
Type of '0' arrow or circle arrow
Appendix: Test of inline style on all element
Simple element
Nested element
Without sub-element

With sub-element

Appendix: Test of style on all element
Simple element
Global style (on componentDiagram)
Style for each element
Nested element (without level)
Global style (on componentDiagram)

Style for each nested element

Nested element (with one level)
Global style (on componentDiagram)

Style for each nested element

Appendix: Test of stereotype with style on all element
Simple element
Display JSON Data on Deployment diagram
Simple example
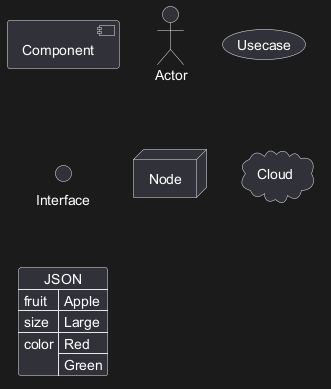
Mixing Deployment (Usecase, Component, Deployment) element within a Class or Object diagram
In order to add a Deployment element or a State element within a Class or Object diagram, you can use the allowmixing or allow_mixing directive.
Mixing all elements
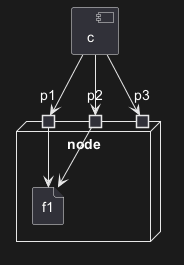
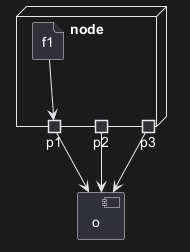
Port [port, portIn, portOut]
You can added port with port, portinand portout keywords.
Port

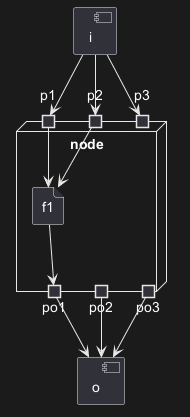
PortIn
PortOut
Mixing PortIn & PortOut
Change diagram orientation
You can change (whole) diagram orientation with:
top to bottom direction(by default)left to right direction
Top to bottom (by default)
With Graphviz (layout engine by default)
The main rule is: Nested element first, then simple element.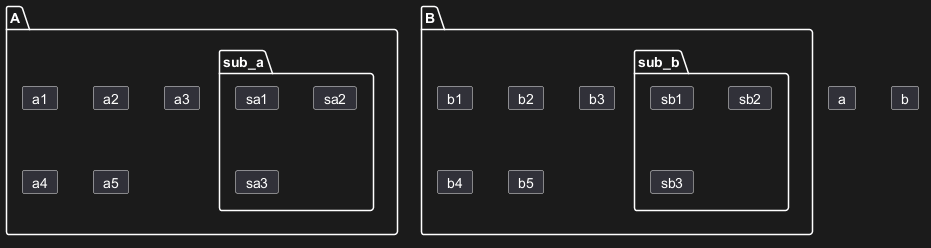
With Smetana (internal layout engine)
The main rule is the opposite: Simple element first, then nested element.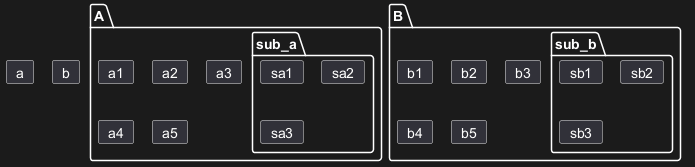
Left to right
With Graphviz (layout engine by default)
With Smetana (internal layout engine)