State Diagram
State diagrams provide a visual representation of the various states a system or an object can be in, as well as the transitions between those states. They are essential in modeling the dynamic behavior of systems, capturing how they respond to different events over time. State diagrams depict the system's life cycle, making it easier to understand, design, and optimize its behavior. Using PlantUML to create state diagrams offers several advantages:- Text-Based Language: Quickly define and visualize the states and transitions without the hassle of manual drawing.
- Efficiency and Consistency: Ensure streamlined diagram creation and easy version control.
- Versatility: Integrate with various documentation platforms and support multiple output formats.
- Open-Source & Community Support: Backed by a strong community that continuously contributes to its enhancements and offers invaluable resources.
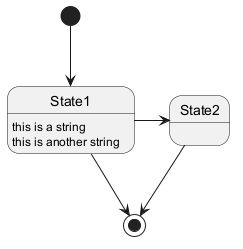
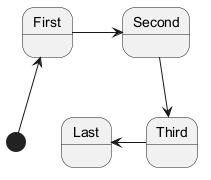
 Simple State
You can use [*] for the starting point and ending point of
the state diagram.
Use --> for arrows.
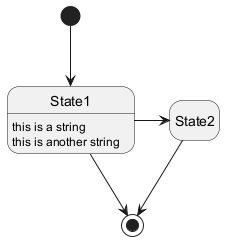
Change state rendering
You can use hide empty description to render state as simple box.
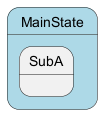
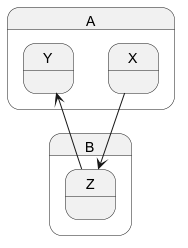
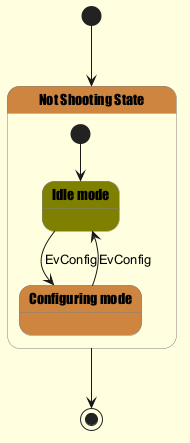
Composite state
A state can also be composite. You have to define it using the state
keywords and brackets.
Internal sub-state
Sub-state to sub-state

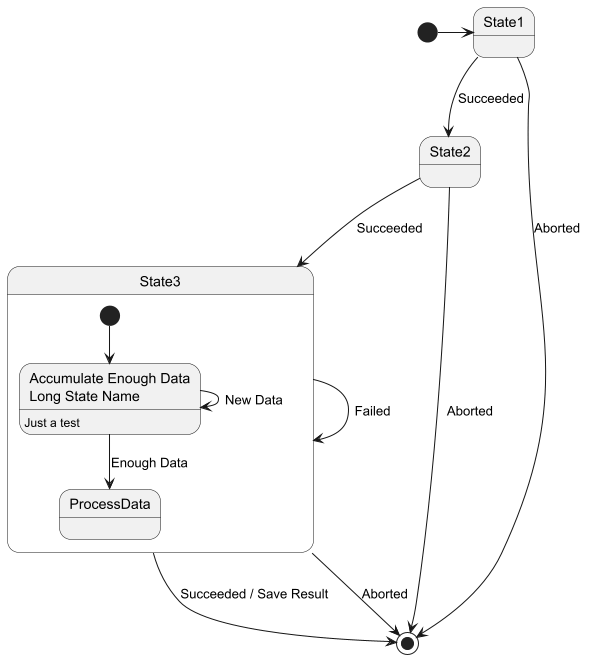
Long name
You can also use the state keyword to use long description
for states.
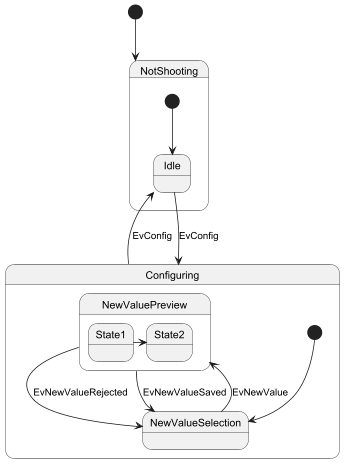
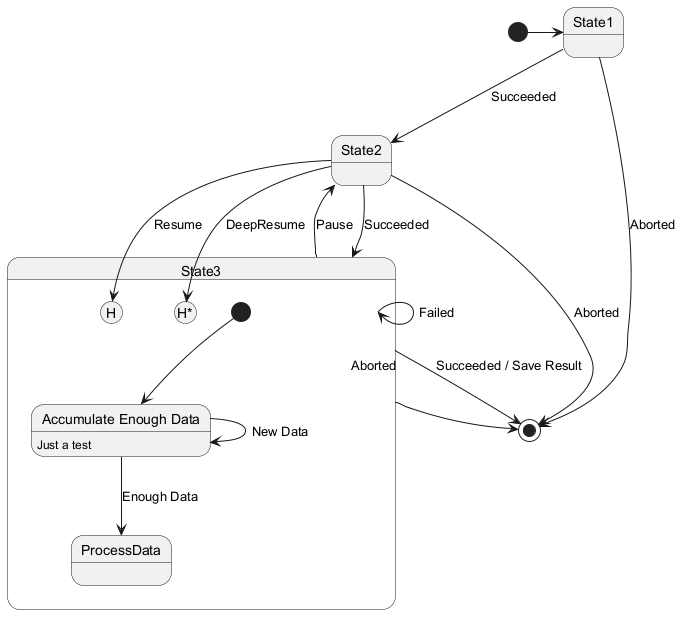
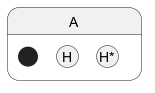
History [[H], [H*]]
You can use [H] for the history and [H*] for the deep history of a substate.
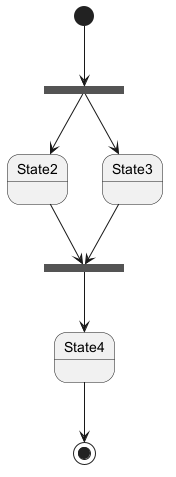
Fork [fork, join]
You can also fork and join using the <<fork>> and <<join>> stereotypes.
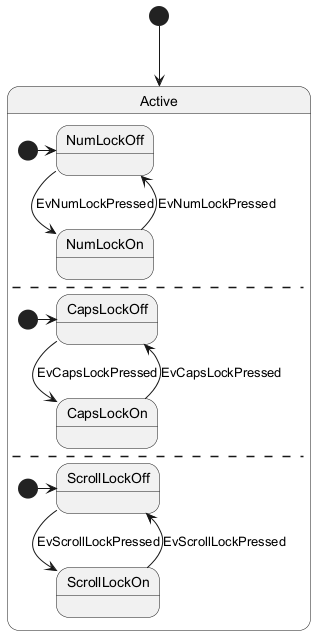
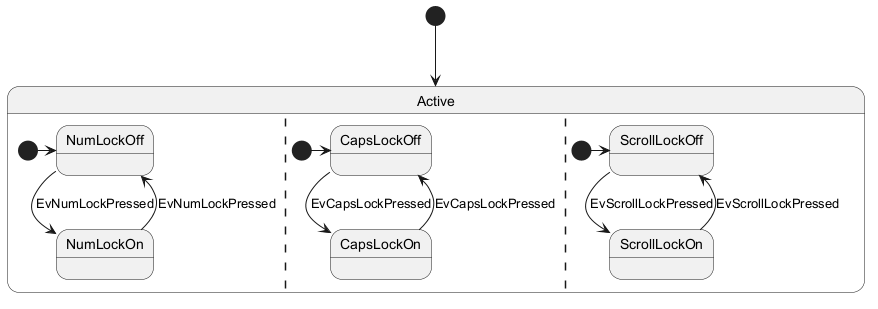
Concurrent state [--, ||]
You can define concurrent state into a composite state using either --
or || symbol as separator.
Horizontal separator --
Vertical separator ||
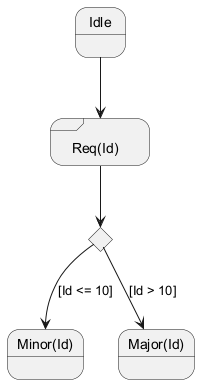
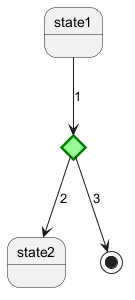
Conditional [choice]
The stereotype <<choice>> can be used to use conditional state.
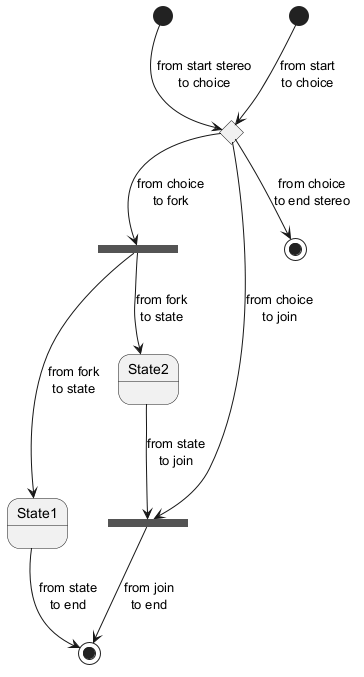
Stereotypes full example [start, choice, fork, join, end, history, history*]
Start, choice, fork, join, end
History, history*
Minimal example with all stereotypes

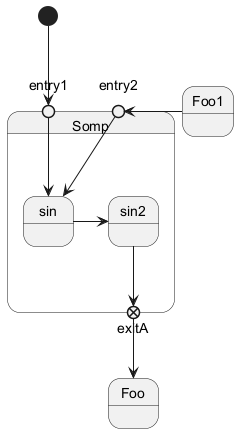
Point [entryPoint, exitPoint]
You can add point with <<entryPoint>> and <<exitPoint>> stereotypes:
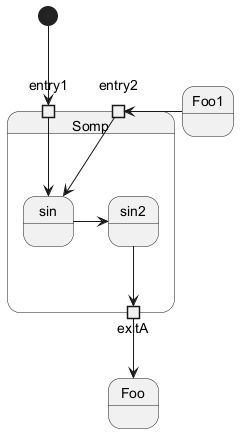
Pin [inputPin, outputPin]
You can add pin with <<inputPin>> and <<outputPin>> stereotypes:
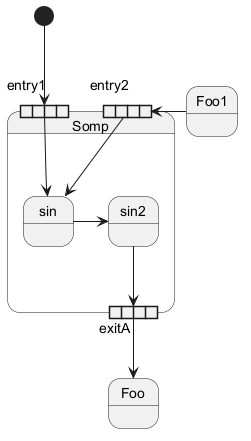
Expansion [expansionInput, expansionOutput]
You can add expansion with <<expansionInput>> and <<expansionOutput>> stereotypes:
Arrow direction
You can use -> for horizontal arrows. It is possible to
force arrow's direction using the following syntax:
-down->or-->-right->or->(default arrow)-left->-up->
-d- instead of
-down-)
or the two first characters (-do-).
Please note that you should not abuse this functionality : Graphviz gives usually good results without tweaking.
Change line color and style
You can change line color and/or line style.
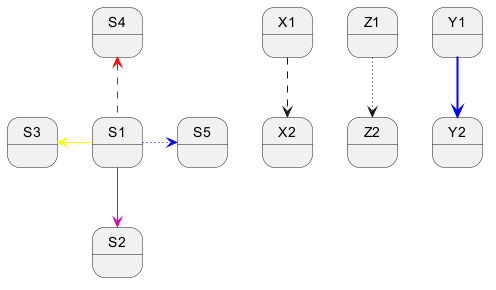
Change head or tail of arrow line

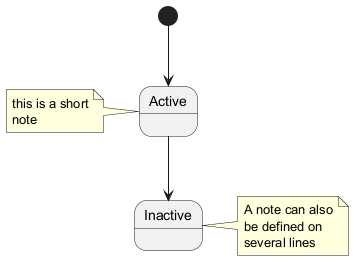
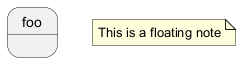
Note
You can also define notes using
note left of, note right of, note top of, note bottom of
keywords.
You can also define notes on several lines.
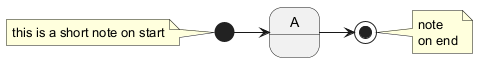
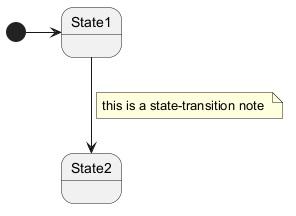
Note on link
You can put notes on state-transition or link, with note on link keyword.
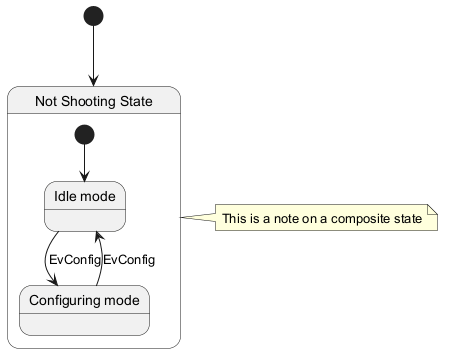
More in notes
You can put notes on composite states.
Inline color
Skinparam
You can use the skinparam command to change colors and fonts for the drawing.
You can use this command :
- In the diagram definition, like any other commands,
- In an included file,
- In a configuration file, provided in the command line or the Ant task.
Test of all specific skinparam to State Diagrams
Changing style
You can change style.
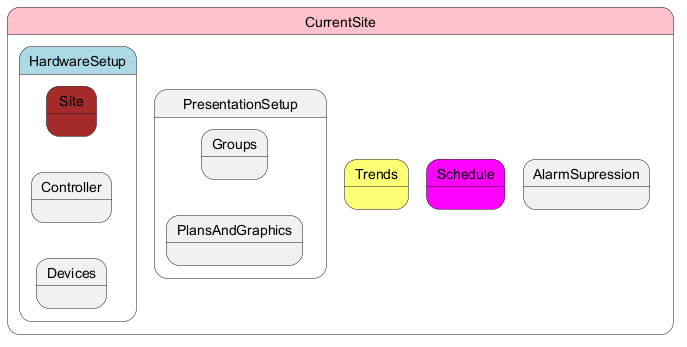
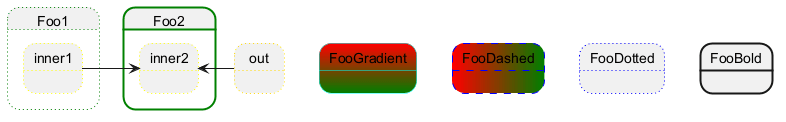
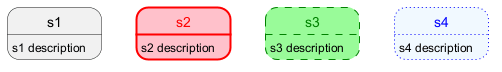
Change state color and style (inline style)
You can change the color or style of individual state using the following notation:
#color ##[style]color
#color), then line style and line color (##[style]color ).

#color;line:color;line.[bold|dashed|dotted];text:color
FIXME
🚩
text:color seems not to be taken into account
FIXME
Alias
With State you can use alias, like:


Display JSON Data on State diagram
Simple example
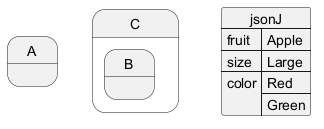
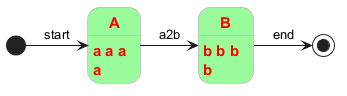
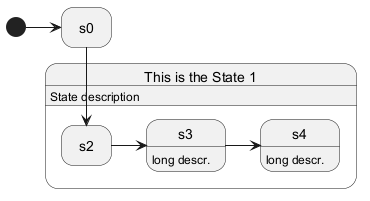
State description
You can add description to a state or to a composite state.
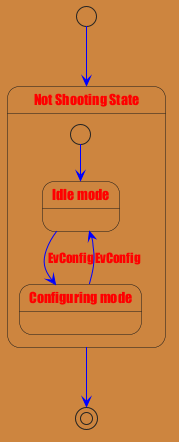
Style for Nested State Body