New! Render PlantUML diagrams directly inside GitHub
with our official browser extension —
No server. No tokens. No tracking. Zero permissions but clipboard. —
Try it out and let us know what you think!
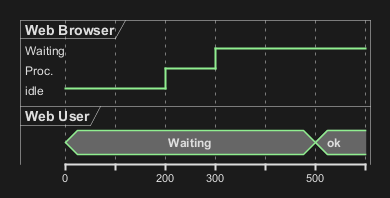
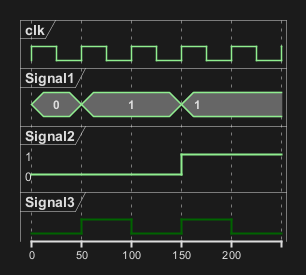
Timing Diagram
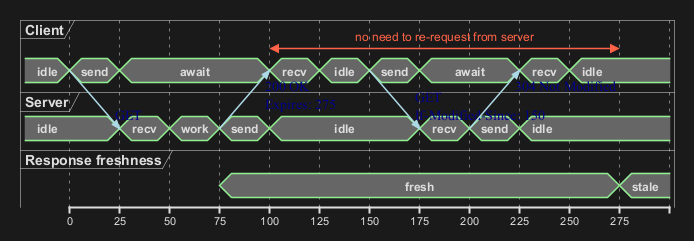
A Timing Diagram in UML is a specific type of interaction diagram that visualizes the timing constraints of a system. It focuses on the chronological order of events, showcasing how different objects interact with each other over time. Timing diagrams are especially useful in real-time systems and embedded systems to understand the behavior of objects throughout a given period. [Ref. of initial request QA-5383] Declaring element or participant
You declare participant using the following keywords, depending on how you want them to be drawn.
| Keyword | Description |
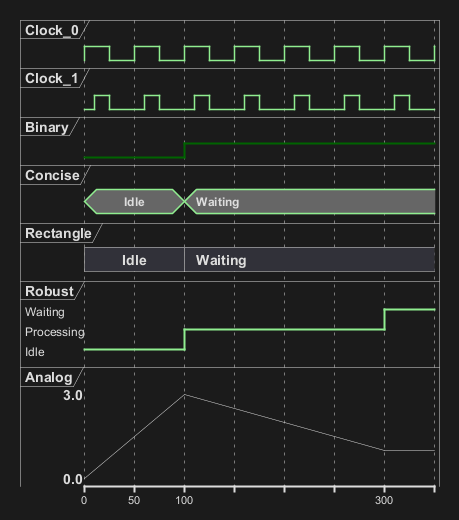
analog
|
An analog signal is continuous, and the values are linearly interpolated between the given setpoints
|
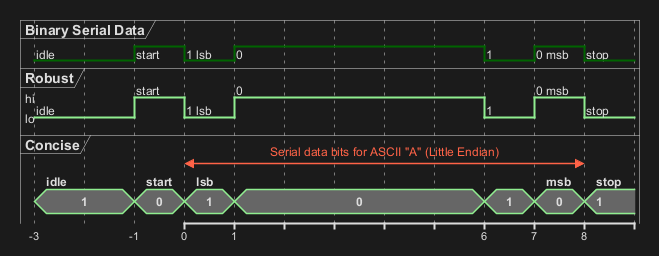
binary
|
A binary signal restricted to only 2 states
|
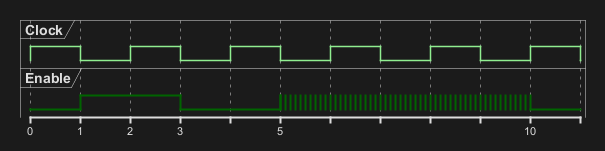
clock
|
A clocked signal that repeatedly transitions from high to low, with a period, and an optional pulse and offset
|
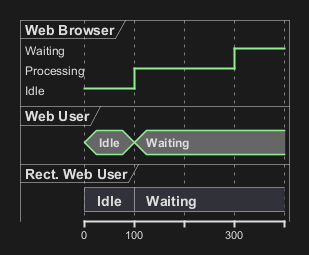
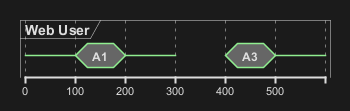
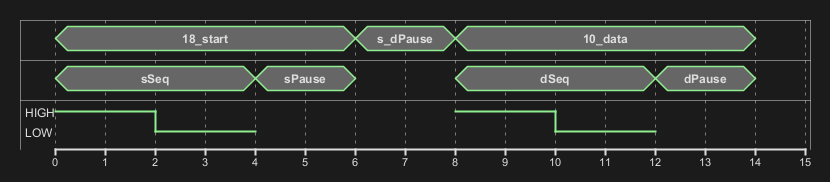
concise
|
A simplified concise signal designed to show the movement of data (great for messages)
|
rectangle
|
A rectangle signal similar to concise but within a rectangle shape
|
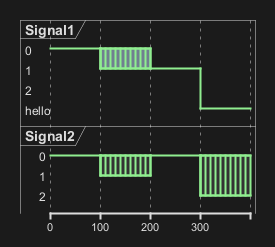
robust
|
A robust complex line signal designed to show the transition from one state to another (can have many states)
|
@ notation, and the is verb.
Binary and Clock
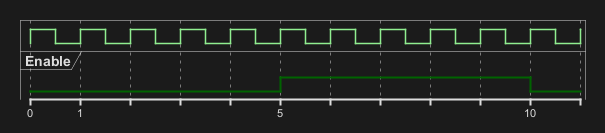
It's also possible to have binary and clock signal, using the following keywords:
binaryclock
Adding message
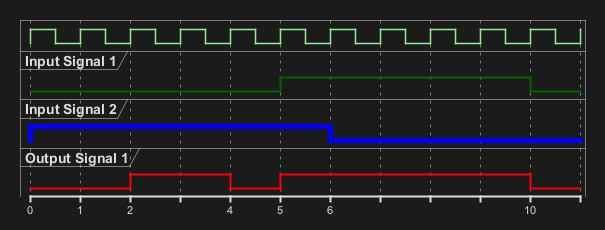
You can add message using the following syntax.
Relative time
It is possible to use relative time with @.
Anchor Points
Instead of using absolute or relative time on an absolute time you can define a time as an anchor point by using the as keyword and starting the name with a :.
@XX as :<anchor point name>
Anchor Points with decimal offset
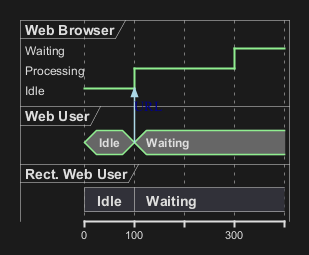
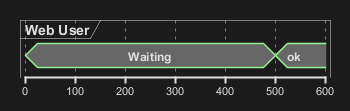
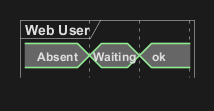
Participant oriented
Rather than declare the diagram in chronological order, you can define it by participant.
Setting scale
You can also set a specific scale.
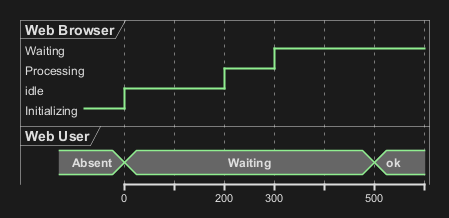
Initial state
You can also define an inital state.
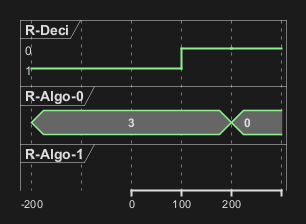
Intricated state
A signal could be in some undefined state.
Intricated or undefined robust state
Intricated or undefined binary state
Hidden state
It is also possible to hide some state.
Negative time value
Hide time axis
It is possible to hide time axis.
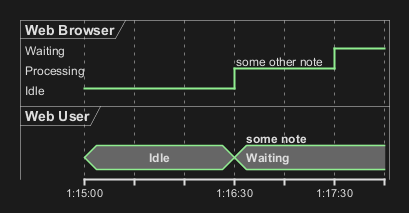
Using Time and Date
It is possible to use time or date.

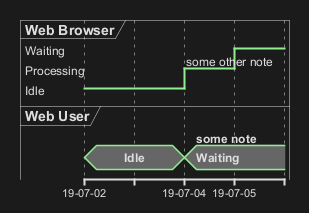
Change Date Format
It is also possible to change date format.
Manage time axis labels
You can manage the time-axis labels.
Label on each tick (by default)

Manual label (only when the state changes)

Adding constraint
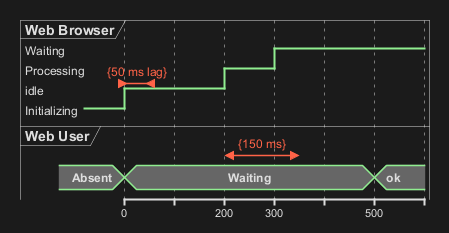
It is possible to display time constraints on the diagrams.
Highlighted period
You can highlight a part of diagram.
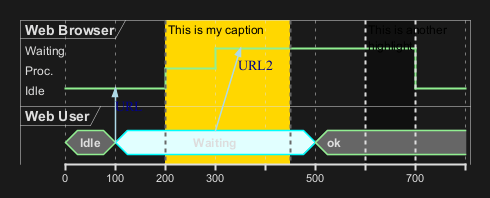
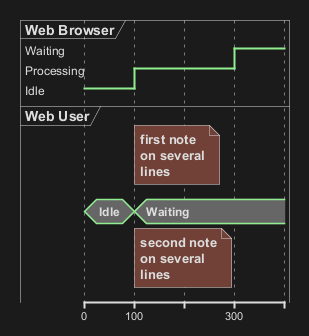
Using notes
You can use the note top of and note bottom of
keywords to define notes related to a single object or participant (available only for concise or binary object).
Adding texts
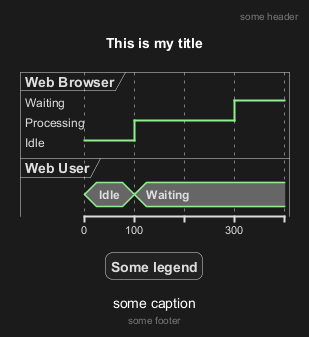
You can optionally add a title, a header, a footer, a legend and a caption:
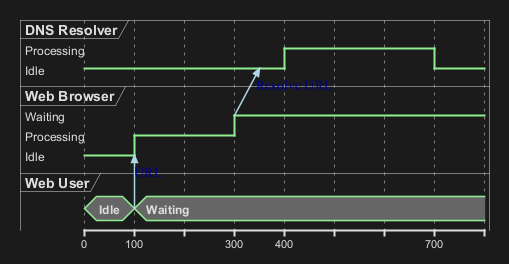
Complete example
Thanks to Adam Rosien for this example.
Digital Example
Adding color
You can add color.
Using (global) style
Without style (by default)
With style
You can use style to change rendering of elements.
Applying Colors to specific lines
You can use the <style> tags and sterotyping to give a name to line attributes.
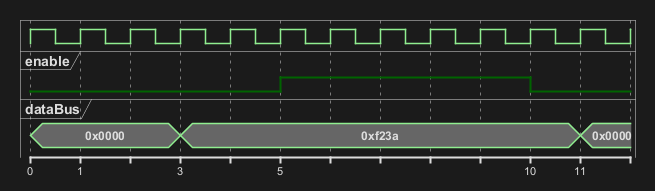
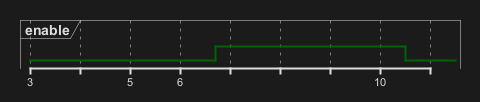
Compact mode
You can use compact command to compact the timing layout.
By default
Global mode with mode compact
Local mode with only compact on element
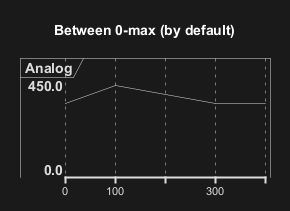
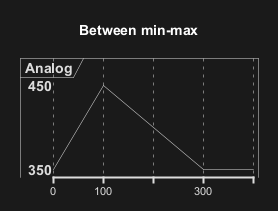
Scaling analog signal
You can scale analog signal.
Without scaling: 0-max (by default)
With scaling: min-max
Customise analog signal
Without any customisation (by default)
With customisation (on scale, ticks and height)
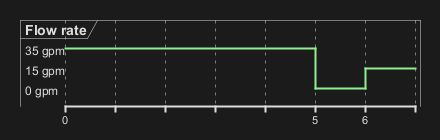
Order state of robust signal
Without order (by default)
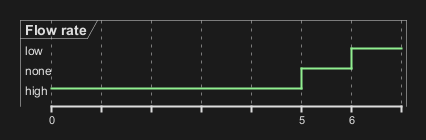
With order
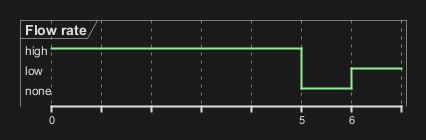
With order and label
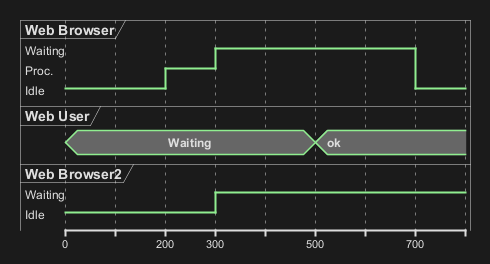
Defining a timing diagram
By Clock (@clk)

By Signal (@S)

By Time (@time)
Annotate signal with comment