





New! Render PlantUML diagrams directly inside GitHub
with our official browser extension —
No server. No tokens. No tracking. Zero permissions but clipboard. —
Try it out and let us know what you think!
Netzwerkdiagramm mit nwdiag
 Edit in Dokuwiki
 Edit in Asciidoc
 Edit in Markdown
 Einfaches Diagramm
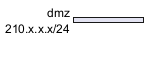
Definieren Sie ein Netzwerk
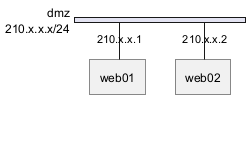
Definieren Sie einige Elemente oder Server in einem Netzwerk
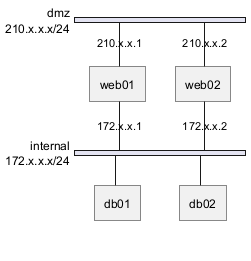
Vollständiges Beispiel
WARNING
This translation need to be updated. WARNING
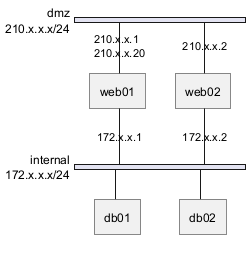
Definieren Sie mehrere Adressen
WARNING
This translation need to be updated. WARNING
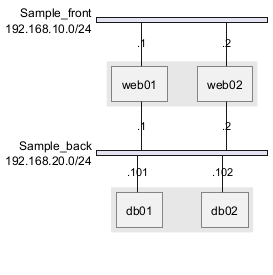
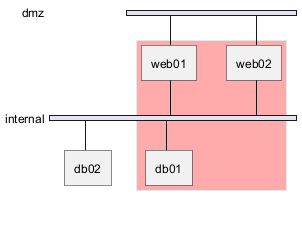
Knoten gruppieren
Gruppe innerhalb von Netzwerkdefinitionen definieren
Gruppe außerhalb von Netzwerkdefinitionen definieren
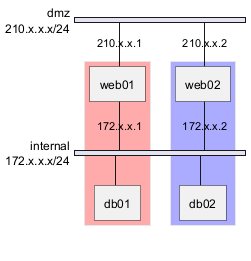
Mehrere Gruppen im selben Netzwerk definieren
Beispiel mit 2 Gruppen
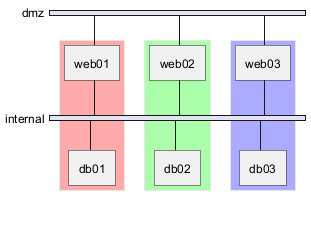
Beispiel mit 3 Gruppen
WARNING
This translation need to be updated. WARNING
Extended Syntax (for network or group)
Network
For network or network's component, you can add or change: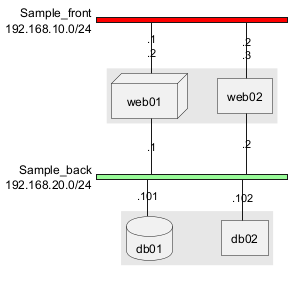
Group
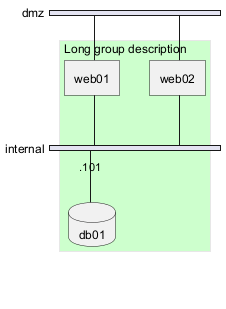
For a group, you can add or change:- color;
- description.
Using Sprites
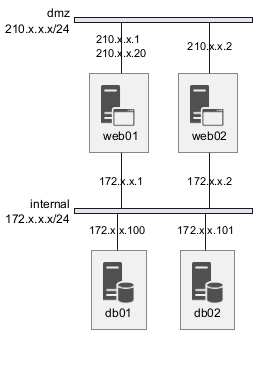
You can use all sprites (icons) from the Standard Library or any other library.
Use the notation <$sprite> to use a sprite, \n to make a new line, or any other Creole syntax.
Using OpenIconic
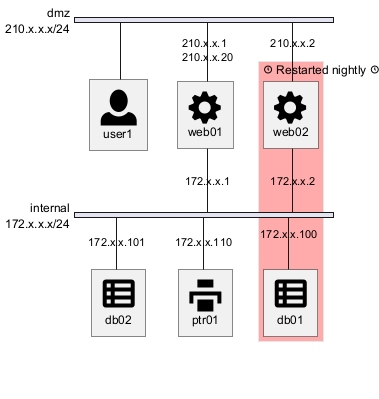
You can also use the icons from OpenIconic in network or node descriptions.
Use the notation <&icon> to make an icon, <&icon*n> to multiply the size by a factor n, and \n to make a newline:
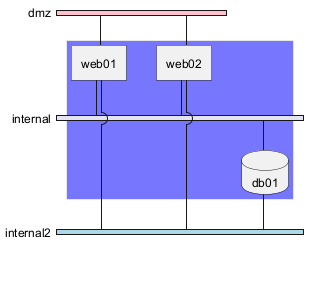
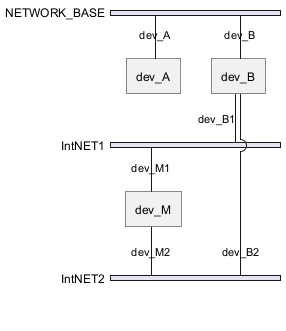
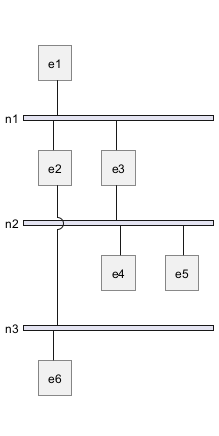
Same nodes on more than two networks
You can use same nodes on different networks (more than two networks); nwdiag use in this case 'jump line' over networks.
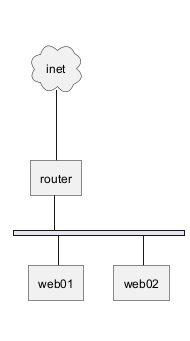
Peer-Netzwerke
Peer-Netzwerke sind einfache Verbindungen zwischen zwei Knoten, für die wir kein horizontales "Stromschienennetz" verwenden
WARNING
This translation need to be updated. WARNING
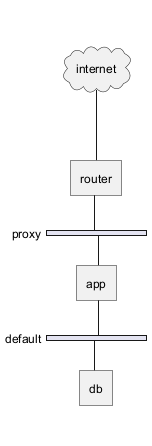
Peer networks and group
Without group
Group on first
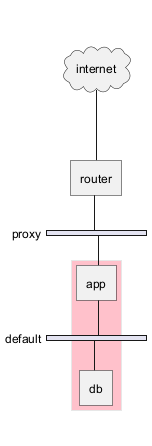
Group on second
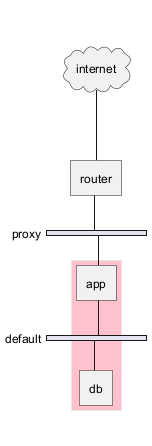
Group on third
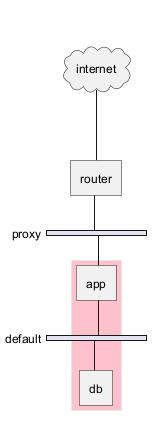
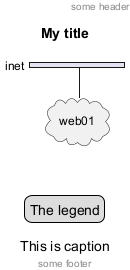
Add title, caption, header, footer or legend on network diagram
With or without shadow
With shadow (by default)
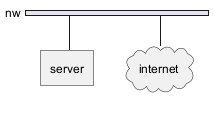
Without shadow
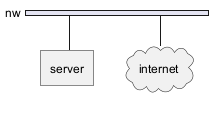
Change width of the networks
You can change the width of the networks, especially in order to have the same full width for only some or all networks.
Here are some examples, with all the possibilities.
First example
- without
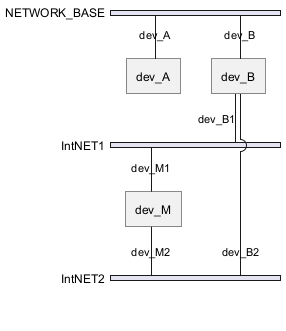
- only the first
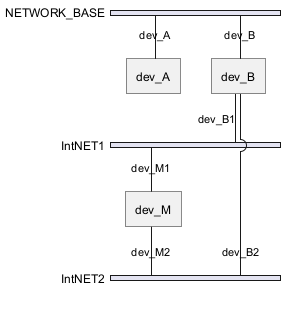
- the first and the second
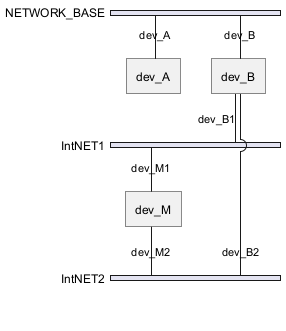
- all the network (with same full width)
Second example
- without
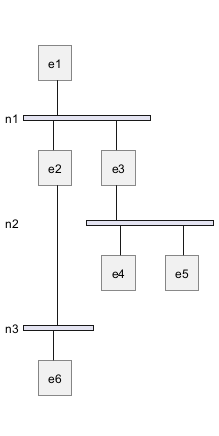
- only the first
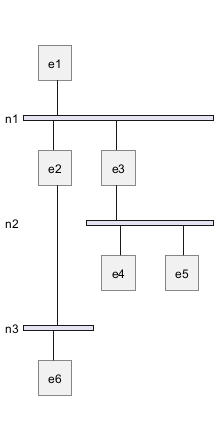
- the first and the second
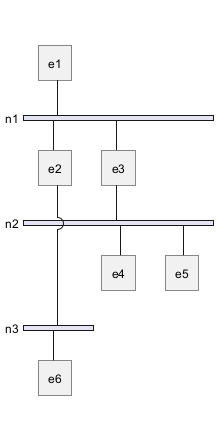
- all the network (with same full width)
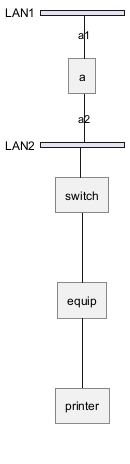
Other internal networks
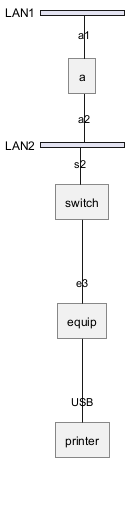
You can define other internal networks (TCP/IP, USB, SERIAL,...).
- Without address or type
- With address or type
Using (global) style
Without style (by default)
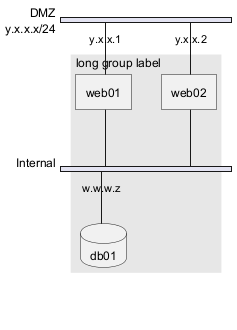
With style
You can use style to change rendering of elements.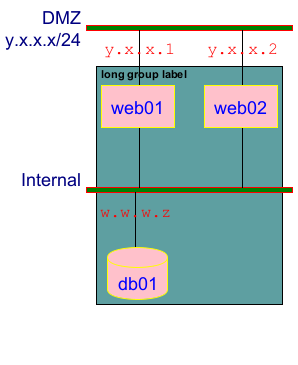
Appendix: Test of all shapes on Network diagram (nwdiag)
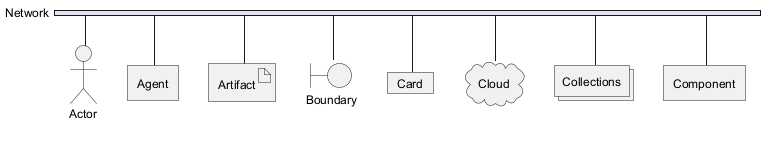


FIXME
- Overlap of label for folder
- Hexagon shape is missing
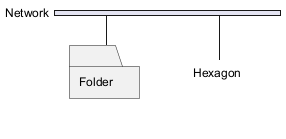
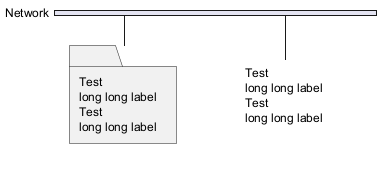
FIXME