New! Render PlantUML diagrams directly inside GitHub
with our official browser extension —
No server. No tokens. No tracking. Zero permissions but clipboard. —
Try it out and let us know what you think!
Timing-Diagramm
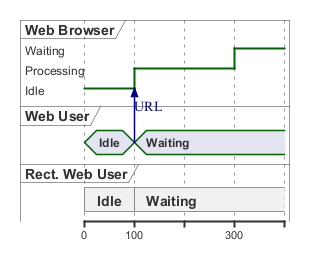
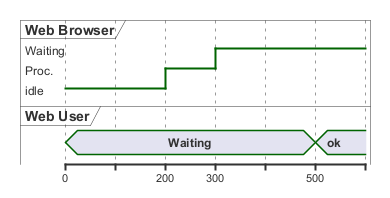
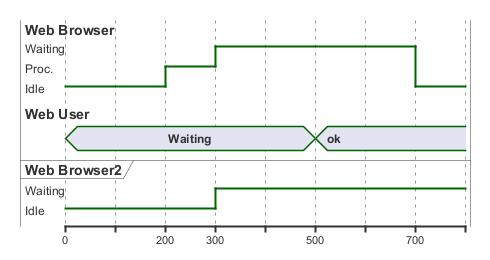
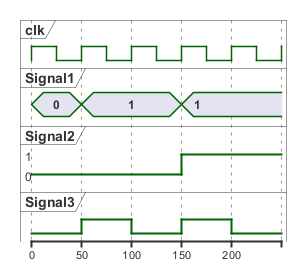
Ein Timing-Diagramm in der UML ist eine spezielle Art von Interaktionsdiagramm, das die zeitlichen Beschränkungen eines Systems visualisiert. Es konzentriert sich auf die chronologische Reihenfolge von Ereignissen und zeigt, wie verschiedene Objekte im Laufe der Zeit miteinander interagieren. Zeitdiagramme sind besonders in Echtzeitsystemen und eingebetteten Systemen nützlich, um das Verhalten von Objekten über einen bestimmten Zeitraum hinweg zu verstehen. [Ref. of initial request QA-5383] Definition von Elementen und Teilnehmern
Schlüsselwörter steuern die Darstellung der Teilnehmer in der Grafik. Mit folgenden Schlüsselwörtern kann die Darstellung gesteuert werden:
| Schlüsselwort | Beschreibung |
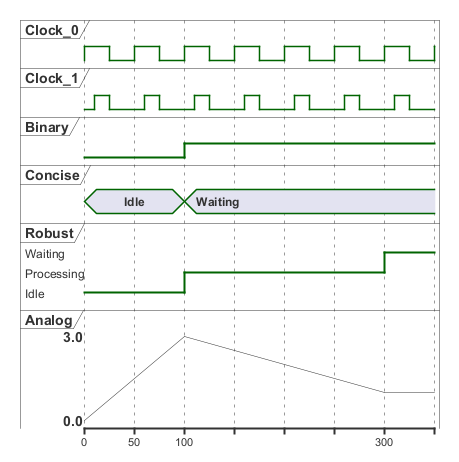
analog
|
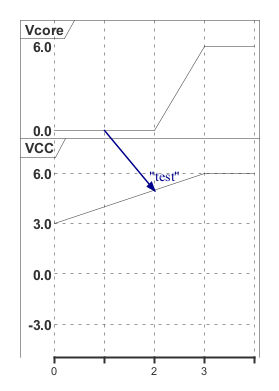
analog stellt den Statusübergang des Teilnehmers als analoges Signal dar, in dem die angegebenen Werte der Stati linear über die in der Zeitlinie gesetzten Zeitpunkte interpoliert werden.
|
binary
|
binary Lässt für den Teilnehmer zwei Status zu, zwischen denen er wechseln kann
|
clock
|
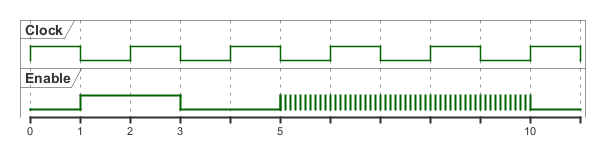
clocked stellt eine Rechtecksignal für den Teilnehmer dar.Mit period wird die Frequenz für den Statuswechsel festgelegt (Muss-Angabe).Mit offset kann der Startzeitpunkt des ersten Signals festgelegt werden.Mit pulse kann die länge des Statusimpulses festgelegt werden
|
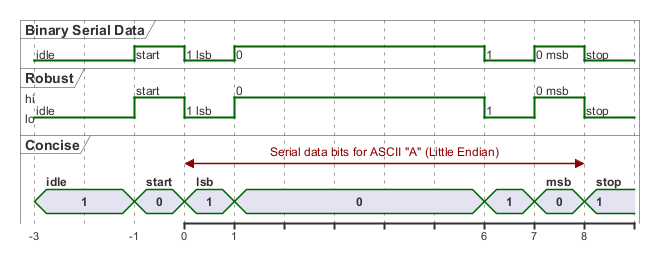
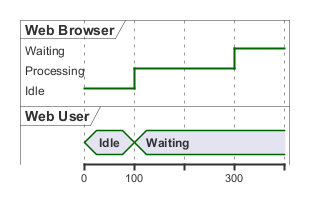
concise
|
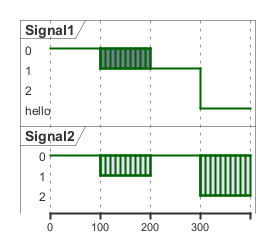
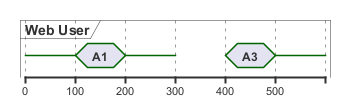
concise ist eine vereinfachte Darstellung um einen Statusübergang eines Teilnehmers darzustellen (Eignet sich am besten für die Darstellung von Meldungssignalen).
|
robust
|
robust stellt eine Signallinie dar, welche den Übergang von verschiedenen Statusübergängen darstellt.
|
@ festgelegt.
Der jeweilige Status des Teilnehmers zu diesem Zeitpunkt wird mit is definiert.
WARNING
This translation need to be updated. WARNING
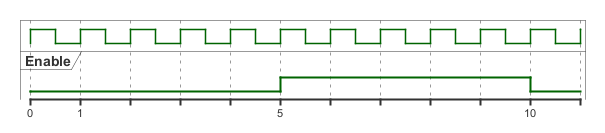
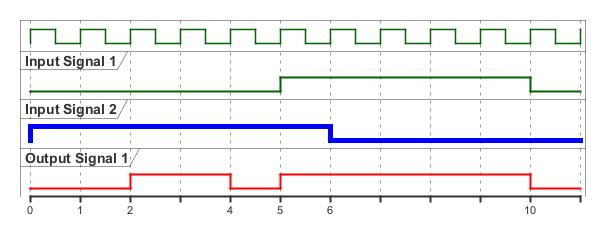
Binary and Clock
It's also possible to have binary and clock signal, using the following keywords:
binaryclock
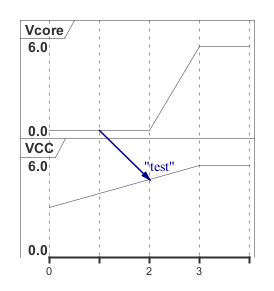
Adding message
You can add message using the following syntax.
Relative time
It is possible to use relative time with @.
Anchor Points
Instead of using absolute or relative time on an absolute time you can define a time as an anchor point by using the as keyword and starting the name with a :.
@XX as :<anchor point name>
Anchor Points with decimal offset
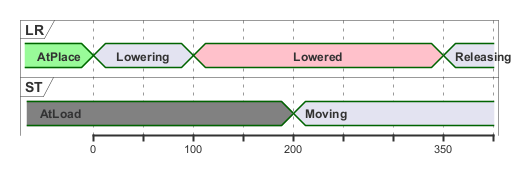
Participant oriented
Rather than declare the diagram in chronological order, you can define it by participant.
Setting scale
You can also set a specific scale.
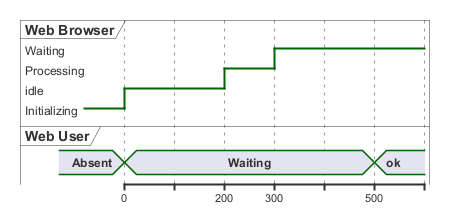
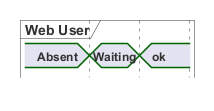
Initial state
You can also define an inital state.
Intricated state
A signal could be in some undefined state.
Intricated or undefined robust state
Intricated or undefined binary state
Hidden state
It is also possible to hide some state.
Negative time value
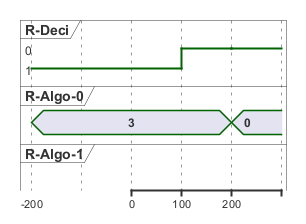
Hide time axis
It is possible to hide time axis.
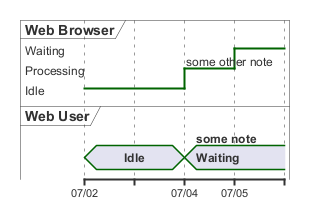
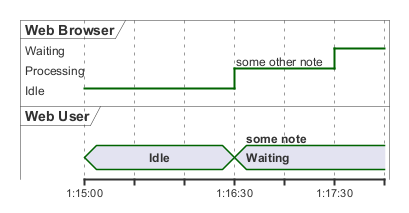
Using Time and Date
It is possible to use time or date.
Change Date Format
It is also possible to change date format.
Manage time axis labels
You can manage the time-axis labels.
Label on each tick (by default)

Manual label (only when the state changes)

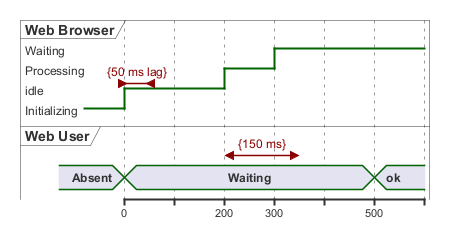
Adding constraint
It is possible to display time constraints on the diagrams.
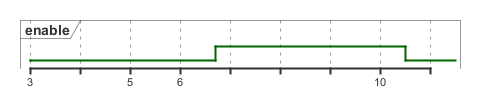
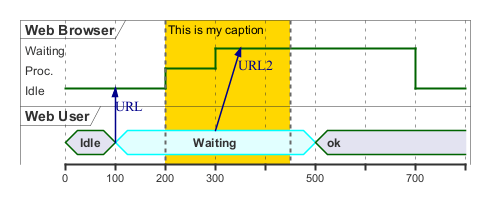
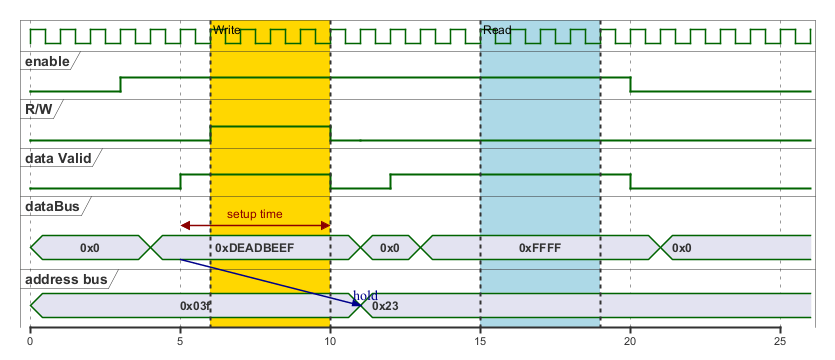
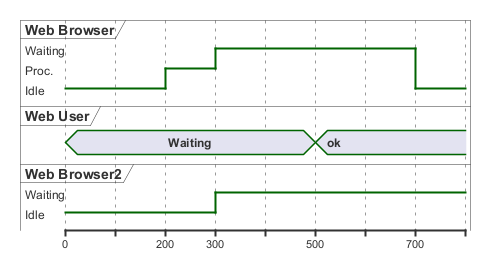
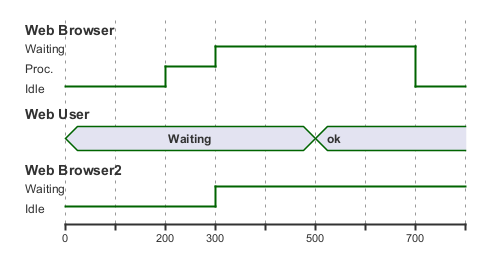
Zeitbereich hervorheben
Im Diagramm kann mit ''highlight'' ein Zeitbereich definiert werden, der farblich hervorgehoben wird.
WARNING
This translation need to be updated. WARNING
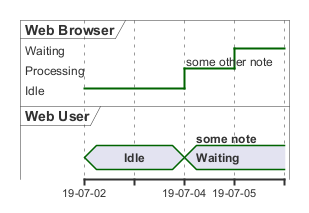
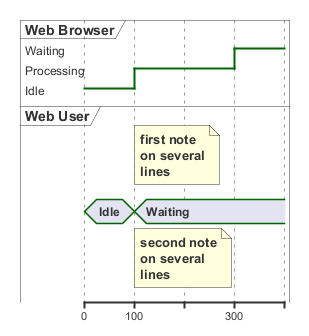
Using notes
You can use the note top of and note bottom of
keywords to define notes related to a single object or participant (available only for concise or binary object).
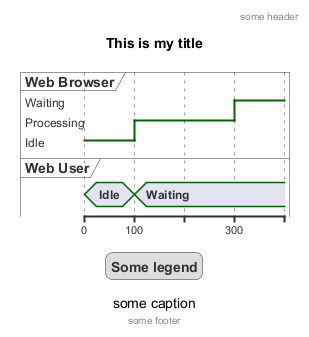
Adding texts
You can optionally add a title, a header, a footer, a legend and a caption:
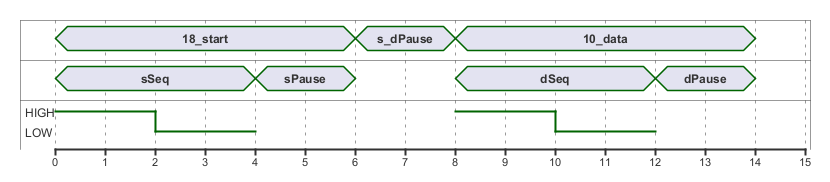
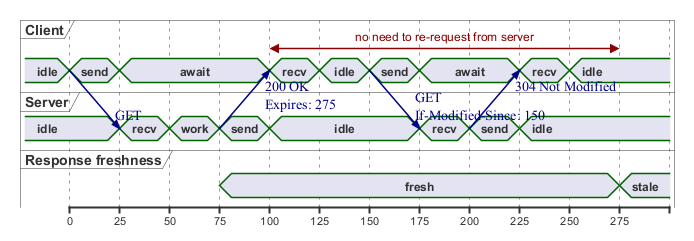
Complete example
Thanks to Adam Rosien for this example.
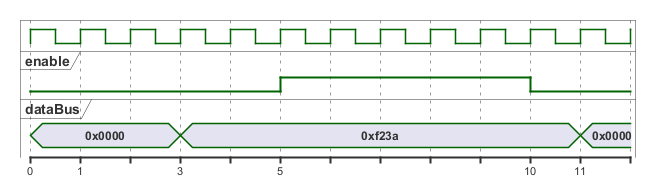
Digitales Beispiel
Adding color
You can add color.
Using (global) style
Without style (by default)
With style
You can use style to change rendering of elements.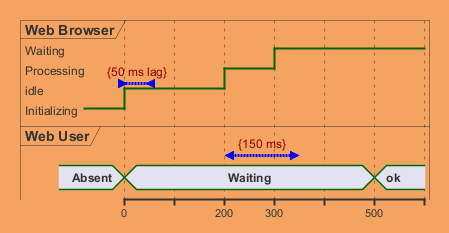
Applying Colors to specific lines
You can use the <style> tags and sterotyping to give a name to line attributes.
Compact mode
You can use compact command to compact the timing layout.
By default
Global mode with mode compact
Local mode with only compact on element
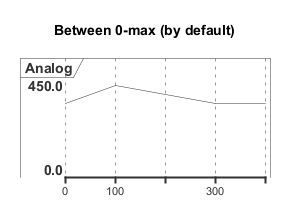
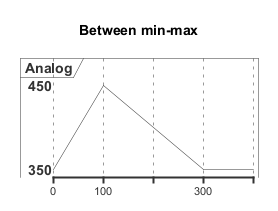
Scaling analog signal
You can scale analog signal.
Without scaling: 0-max (by default)
With scaling: min-max
Customise analog signal
Without any customisation (by default)
With customisation (on scale, ticks and height)
Order state of robust signal
Without order (by default)
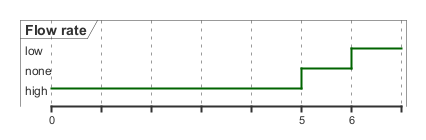
With order
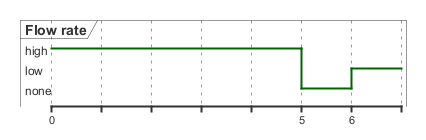
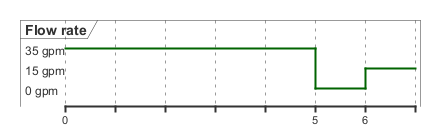
With order and label
Defining a timing diagram
By Clock (@clk)

By Signal (@S)
By Time (@time)

Annotate signal with comment